
Q2 2026 Investment Outlook
Macro outlook and market implications
As we move through 2026, a simultaneous rise in geopolitical risk and policy uncertainty is reshaping global financial markets.
The macro backdrop entering this year was one of resilient but uneven growth, supported by AI-driven capital expenditure, gradual disinflation, and improving trade conditions. Importantly, this environment has been accompanied by a broadening-out in market leadership, with value sectors, emerging markets and non-US equities beginning to close the long-standing performance gap with the US.
However, recent conflict in the Middle East, combined with ongoing trade frictions and tariff uncertainty, have pushed both geopolitical risk indices and policy uncertainty measures to their highest levels since 2022. Although this does not, in itself, imply recession, it does add to an already fragile growth backdrop.
Commodity markets were the quickest to react, with oil prices rising above US$ 100 per barrel. This oil shock disrupts an environment where real energy prices and input costs had fallen back to low levels. In that sense, it is less a continuation of an existing inflation problem and more a test of whether the global economy can absorb another supply-side disturbance without a material change in regime.
As a supply-side shock, oil affects the macro system through multiple channels simultaneously, including compressing corporate margins, feeding into inflation and influencing labour market dynamics, while also complicating central bank reaction functions. The key uncertainty is not the initial spike, but its persistence.
This gives rise to a range of potential macroeconomic outcomes, contingent on the duration of elevated oil prices and the associated policy responses, which together underpin our scenario framework. As a result, the continuation of the rotation in market leadership remains conditional. The broadening story ultimately depends on whether profits outside the US can deliver, rather than relying on a re-rating of market prices.
While earnings expectations for emerging markets and Asia have been revised meaningfully higher, the durability of this shift depends on whether these regions can translate improved expectations into realised profit growth.
The current environment therefore is transitioning toward one of moderate growth, heightened geopolitical uncertainty and a gradual broadening of market leadership. While episodic volatility is likely, the underlying structural drivers of growth – particularly technology investment and improving emerging-market resilience – continue to support a relatively constructive medium-term outlook for global markets.
Figure 1: US policy uncertainty index (black) and VIX volatility (red)
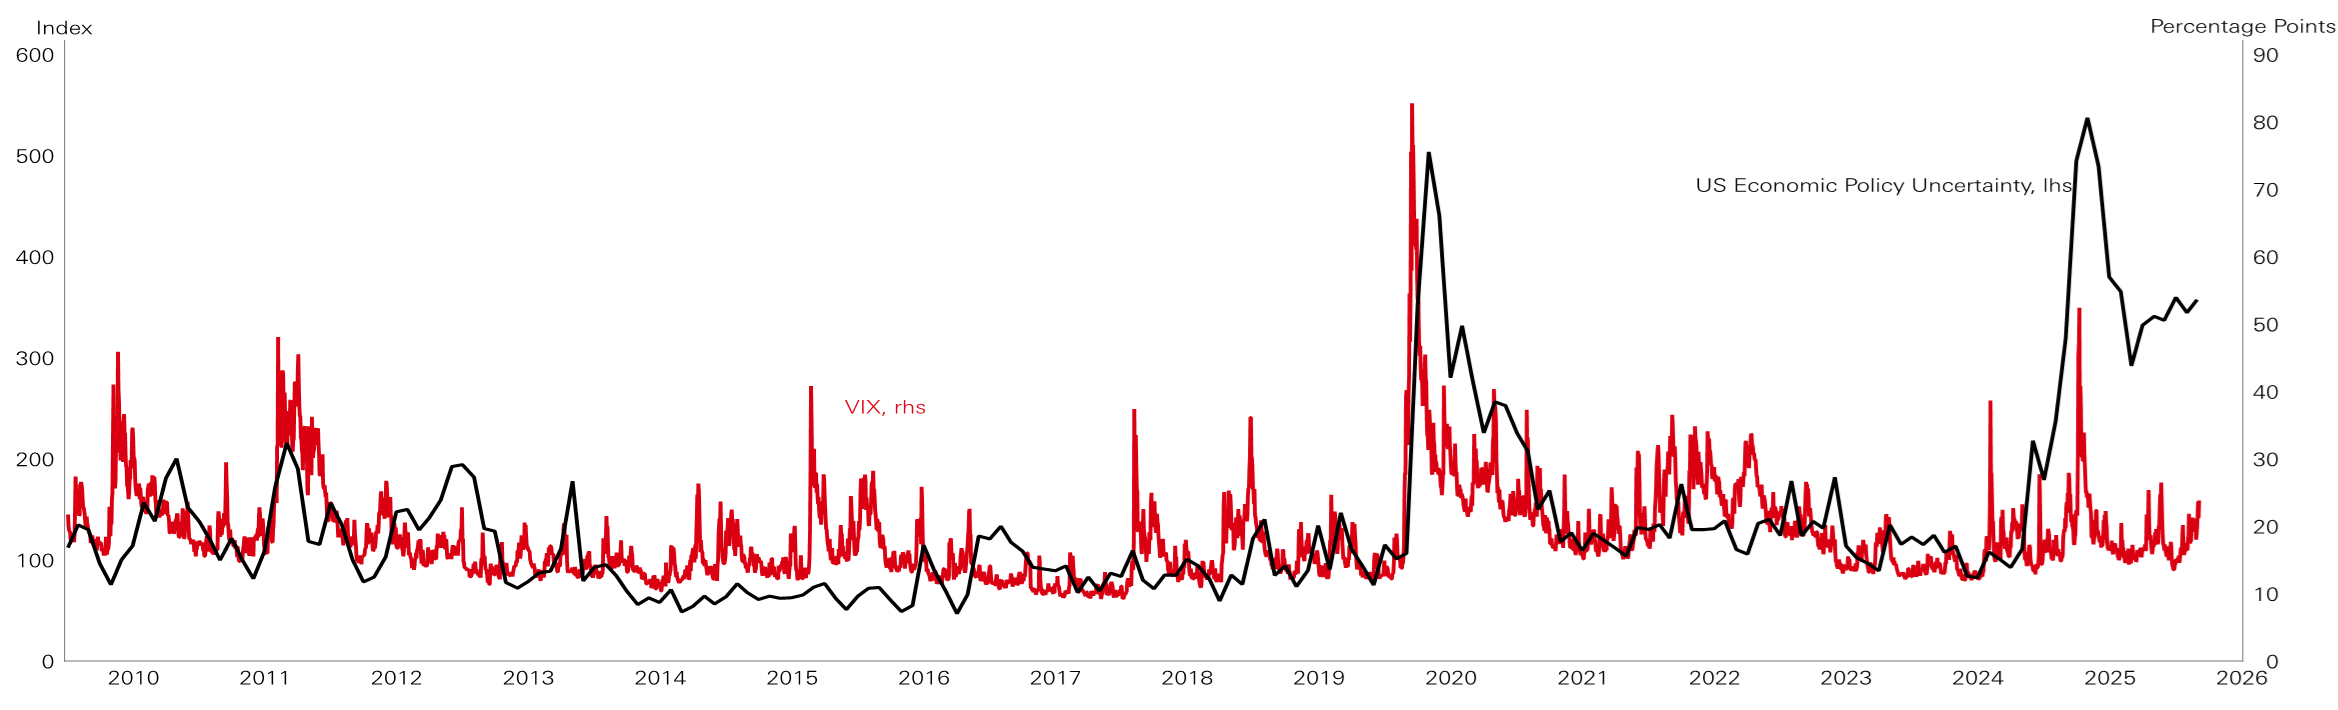
Click the image to enlarge
Source: Macrobond, Bloomberg, HSBC Asset Management, March 2026.
Scenarios
The macroeconomic landscape is best understood through the interaction between oil price dynamics, policy responses and the durability of the underlying growth cycle.
Our central scenario of “come together” assumes the oil shock proves transitory, consistent with the historical pattern of geopolitical events generating sharp but short-lived volatility. Under this scenario, oil prices gradually return closer to pre-event levels. The macroeconomic impact remains modest, reducing global growth but not triggering a downturn. For most economies, the hit to GDP would likely be limited to less than half a percentage point.
Inflation would rise temporarily due to higher energy prices, but the effect on core inflation would remain contained. Policy makers will try and look through the shock, while ensuring inflation expectations remain anchored.
Any tightening is likely to be limited and may prove unnecessary. Importantly, the Federal Reserve is still likely to eventually ease given risks to the labour market leg of its mandate.
This backdrop implies some episodic near-term volatility. But ultimately, moderate growth and receding inflation pressures later in the year can underpin a more constructive, albeit selective, medium-term market environment. The broadening out theme continues as earnings growth outside the US begins to materialise.
The more challenging case of “cracks widening” becomes relevant if the oil shock persists, more akin to 2022, with elevated energy prices feeding into weaker labour markets and tighter financial conditions.
Here, the issue stops being a temporary inflation pulse and becomes a growth problem. Higher energy costs begin to squeeze margins more durably, weaken demand and expose existing fragilities in labour markets and public finances, particularly in energy-importing regions.
Central banks then face renewed stagflationary pressures, and a difficult balancing act of preserving inflation credibility but without triggering undue economic damage. In that scenario, volatility becomes more persistent, and the broadening narrative is tested much more seriously.
A more constructive but less probable scenario is “AI boom”. Here, the oil shock still fades, but the underlying cycle proves stronger than expected as AI-led capex and productivity gains spread more widely across sectors and regions. Growth broadens more decisively, inflation continues to ease and risk appetite improves further. This would reinforce the case for broader market leadership beyond the US.
Across all scenarios, the global economy is becoming more multi-speed and less synchronised, with outcomes increasingly shaped by energy exposure, policy flexibility and the ability of firms and economies to sustain earnings in a less benign environment.
Figure 2: Macro and market scenarios
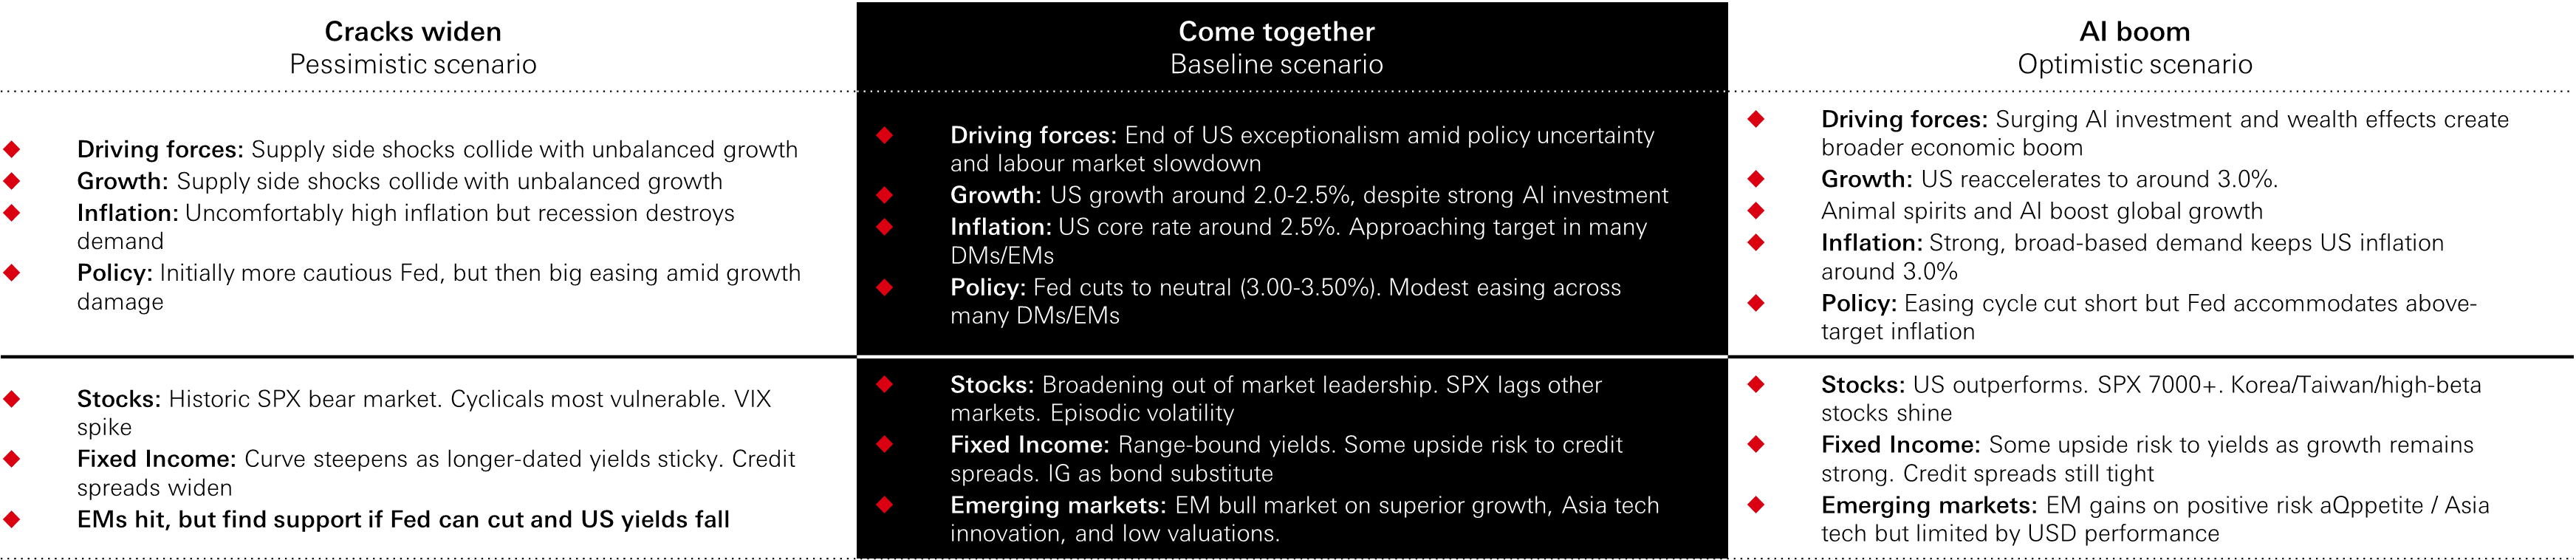
Click the image to enlarge
Market implications
In a more fragile world, the central investment question remains whether the “profits glue” holds and which diversification frameworks work during inflation-driven shocks.
While the broadening out story remains alive, it requires profits delivery. For most of the past decade, US markets have dominated because they consistently delivered superior profit growth. Recent rotations reflect expectations that other regions can close that gap. In some areas, that hope is increasingly well founded. Earnings expectations in emerging markets and Asia have improved materially, supported by technology spillovers and the global capex cycle. But in others, especially Europe, the outlook remains more vulnerable to energy costs and margin pressure.
In our view, the broadening theme can continue, but equity performance is likely to become more dispersed, with returns increasingly driven by realised earnings rather than multiple expansion.
In fixed income, the current environment reinforces the need to reassess traditional roles. The re-emergence of positive stock–bond correlation, as seen in recent weeks, highlights the limitations of duration as a reliable hedge in supply-driven inflation shocks.
At the same time, yields are increasingly shaped by fiscal dynamics, term premia and central bank credibility. In the US, that means duration remains exposed to fiscal arithmetic as much as to growth. In Europe, weak growth and energy sensitivity complicate the policy path. This is an environment where carry, curve positioning and selective credit matter more than simple duration beta.
More broadly, recent market behaviour has reinforced a key structural message that traditional hedges are less reliable in a supply-shock regime. During both 2022 and the current episode, government bonds and gold have failed to provide consistent protection, while the US dollar has remained the primary effective hedge. But even here, US dollar gains have been modest. And with “dollar down” a key theme in 2025-26, it is not a fully dependable hedge either.
These instances of overlapping shocks and less stable correlations underscores that portfolio construction is becoming less about owning a single safe asset and more about the selection of diversifiers that can work under different kinds of stress. This means investors may need to incorporate a wider range of defensive assets, including currencies, commodities and alternative strategies, to manage periods of macroeconomic and market volatility.
Figure 3: Views per asset class
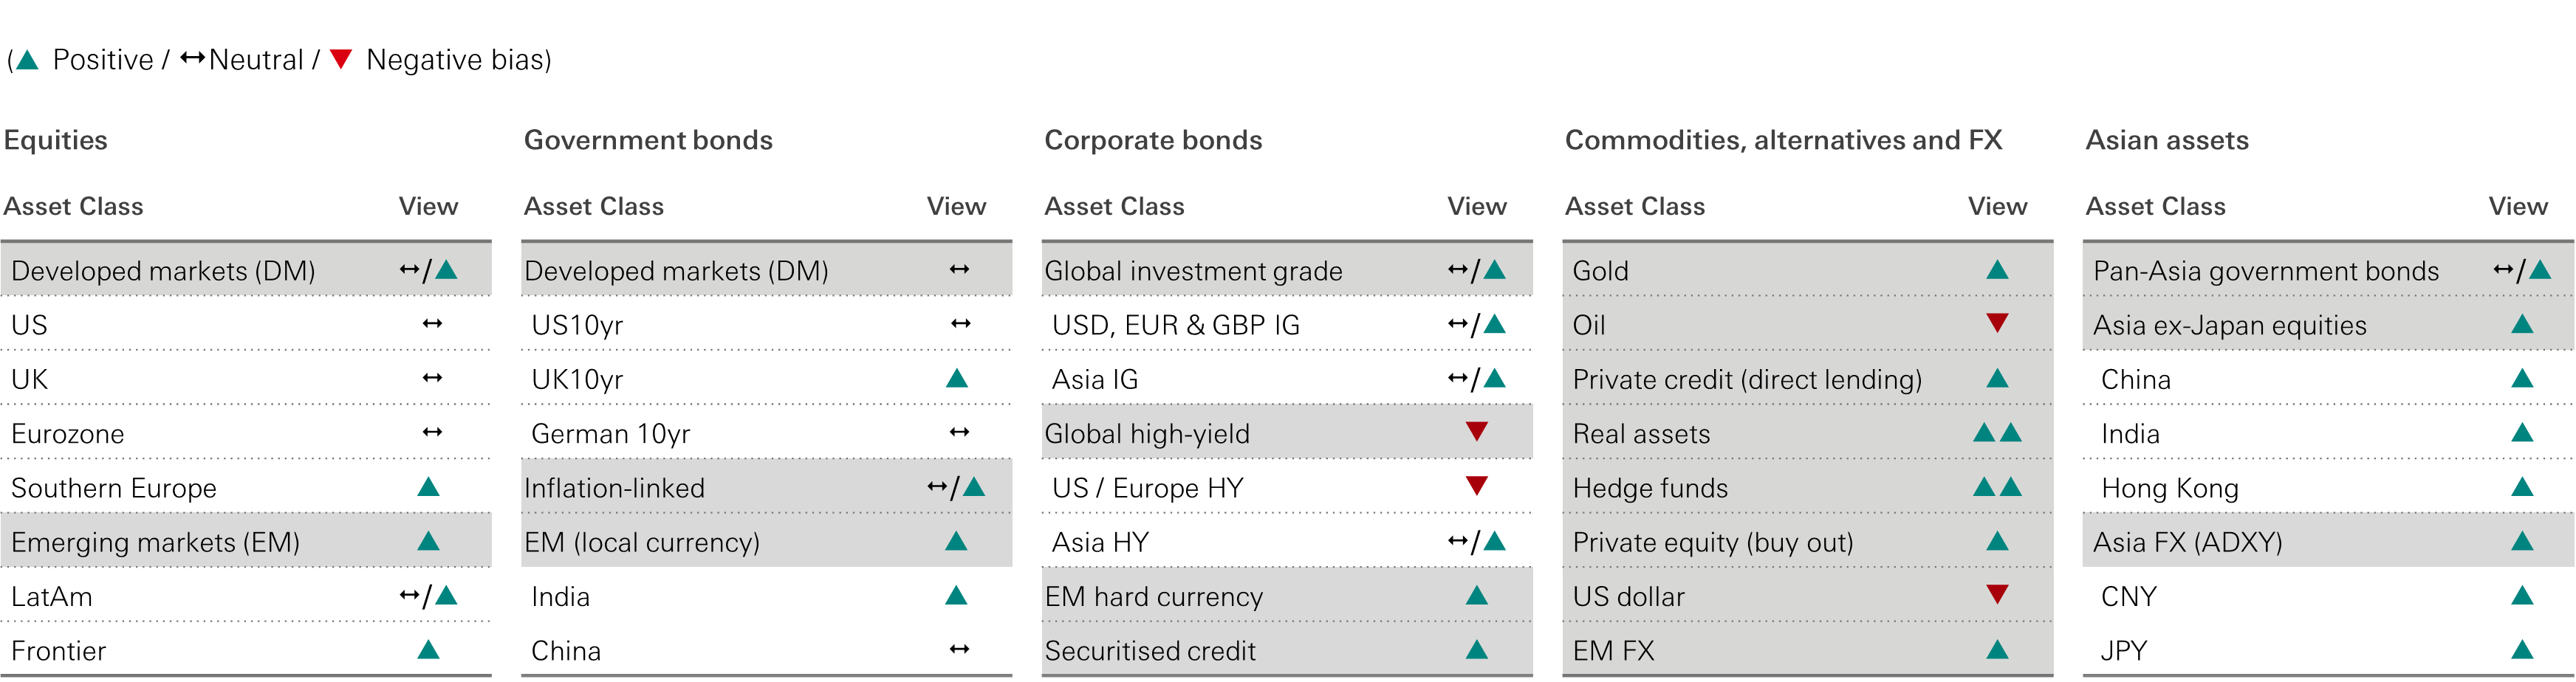
Click the image to enlarge
Top of mind
Could private credit become a broader market risk?
Private credit is attracting the kind of attention that usually appears when markets begin to ask whether an area of rapid growth has also become a source of fragility. The asset class has expanded quickly, retail access has widened, and recent stress around liquidity terms, software exposure and business development company (BDC) structures has sharpened concerns about whether a contained problem could become systemic.
For investors, however, the more useful distinction is between headline events and system‑wide risk. On that measure, the evidence still points to the former rather than the latter. Private credit is now large, but the parts of the market causing most concern remain a subset of a broader credit ecosystem. Within US leveraged finance, direct lending accounts for roughly 30 per cent of the market, while BDCs represent about half a trillion dollars of assets — only around 12.5 per cent of the overall leveraged finance universe. The most discussed segment is still relatively modest in size compared with the market it sits within.
That does not mean there are no vulnerabilities. Non‑traded BDCs have exposed the classic mismatch between illiquid underlying assets and periodic investor liquidity, while concerns around software lending have raised the possibility that AI‑related disruption could lead to higher defaults in pockets of private credit.
Figure 1: CDLI – PIK as a per cent of total income and non-accruals

Click the image to enlarge
Source: HSBC Alternatives, Cliffwater, December 2025.
Yet even under severe stress assumptions — including very high software default rates and zero recoveries — the stronger BDC structures appear to retain meaningful asset coverage, largely because starting leverage remains relatively low.
One important mitigant to these liquidity frictions is the growth of the private credit secondary market, which has evolved from a niche outlet for distressed positions into a broader portfolio‑management tool for limited and general partners. Secondary transactions allow investors to buy or sell interests in existing funds, often in seasoned, income‑generating portfolios, and fundraising in credit secondaries has accelerated, with the market contributing US$16.1 billion to the US$234.1 billion of private debt fundraising in 2025. This expanding pool of secondary capital provides an additional outlet when retail‑heavy vehicles become forced sellers, reducing the risk that localised redemption pressure translates into broader market dislocation.
The link to the banking system also appears more limited than some of the rhetoric implies. Banks’ exposure to non‑depository financial institutions has certainly risen, but exposures to business credit intermediaries still represent only a small share of total loan books at the large US banks and are typically structured on a senior secured, over‑collateralised basis. That makes this more a question of selective credit stress than broad balance‑sheet contagion.
The broader macro point is that private credit is unlikely to become a system‑wide problem unless it coincides with excessive leverage across the economy more generally. On that front, aggregate US private‑sector leverage does not currently point to the sort of imbalances that typically precede systemic crises. For now, private credit warrants close scrutiny — particularly on liquidity terms, underwriting standards and sector concentration — but the balance of evidence suggests a contained credit issue rather than the start of a broader financial accident.
What can hedge funds offer in periods of high uncertainty?
The traditional 60/40 portfolio has encountered difficulties in recent times. Most starkly in 2022, when we saw the correlation between bonds and equities move firmly into positive territory, with fixed income and stocks both moving lower as central banks sharply hiked interest rates.
Against this backdrop, some areas of the alternative investment space provided investors with welcome relief. Hedge funds, in particular, were able to harness the volatility of markets at the time and demonstrated that they can provide investors with diversification just as more traditional strategies face headwinds.
This diversification can be particularly attractive in the current period of heightened uncertainty that markets are experiencing today.
Volatility has spiked in the wake of the conflict in the Middle East, but past instances of high geopolitical and market risk have often provided a fertile opportunity set for skilled hedge fund managers to exploit.
In particular, hedge funds can capitalise on pricing dislocations within rates, debt, commodity, and FX markets, taking both long and short positions and adjusting risk dynamically as conditions evolve.
The spike in geopolitical risk has also exacerbated risks in other markets, such as interest rate risk. There is much less certainty around the direction of interest rates, with markets pricing in rate hikes from some major central banks, having previously expected rate cuts. For macro and credit hedge fund managers, higher rates, greater dispersion and more persistent volatility are often a constructive backdrop for generating returns and managing downside risk.
Beyond the headline volatility is a backdrop of active corporate deal making. Towards the end of 2025, IPO and M&A activity came back with a vengeance, as lofty valuations and tight credit spreads entrenched optimism for deals. In the fourth quarter of 2025, there was a 20% quarter-on-quarter increase in M&A volumes, with a particularly strong increase in Asia. This backdrop can provide opportunities for event-driven and credit hedge fund managers, which aim to capitalise on the price discrepancies and spread dispersion that arise around corporate actions.
Figure 2: Hedge funds correlation to 60/40 portfolios during periods of extreme market volatility
Click the image to enlarge
Source: HSBC AM, Bloomberg, HFRI. Time period presented is from January 1990 to February 2026. Traditional 60/40 portfolio is made up of 60 per cent Global Equities (MSCI World Index) and 40 per cent Global Bonds (JP Morgan Global Government Bond Index unhedged in USD). Hedge Funds are represented by the HFRI Macro Index. Correlation is calculated on a 12-month rolling basis. There is no guarantee the trend illustrated in the graph above will continue.
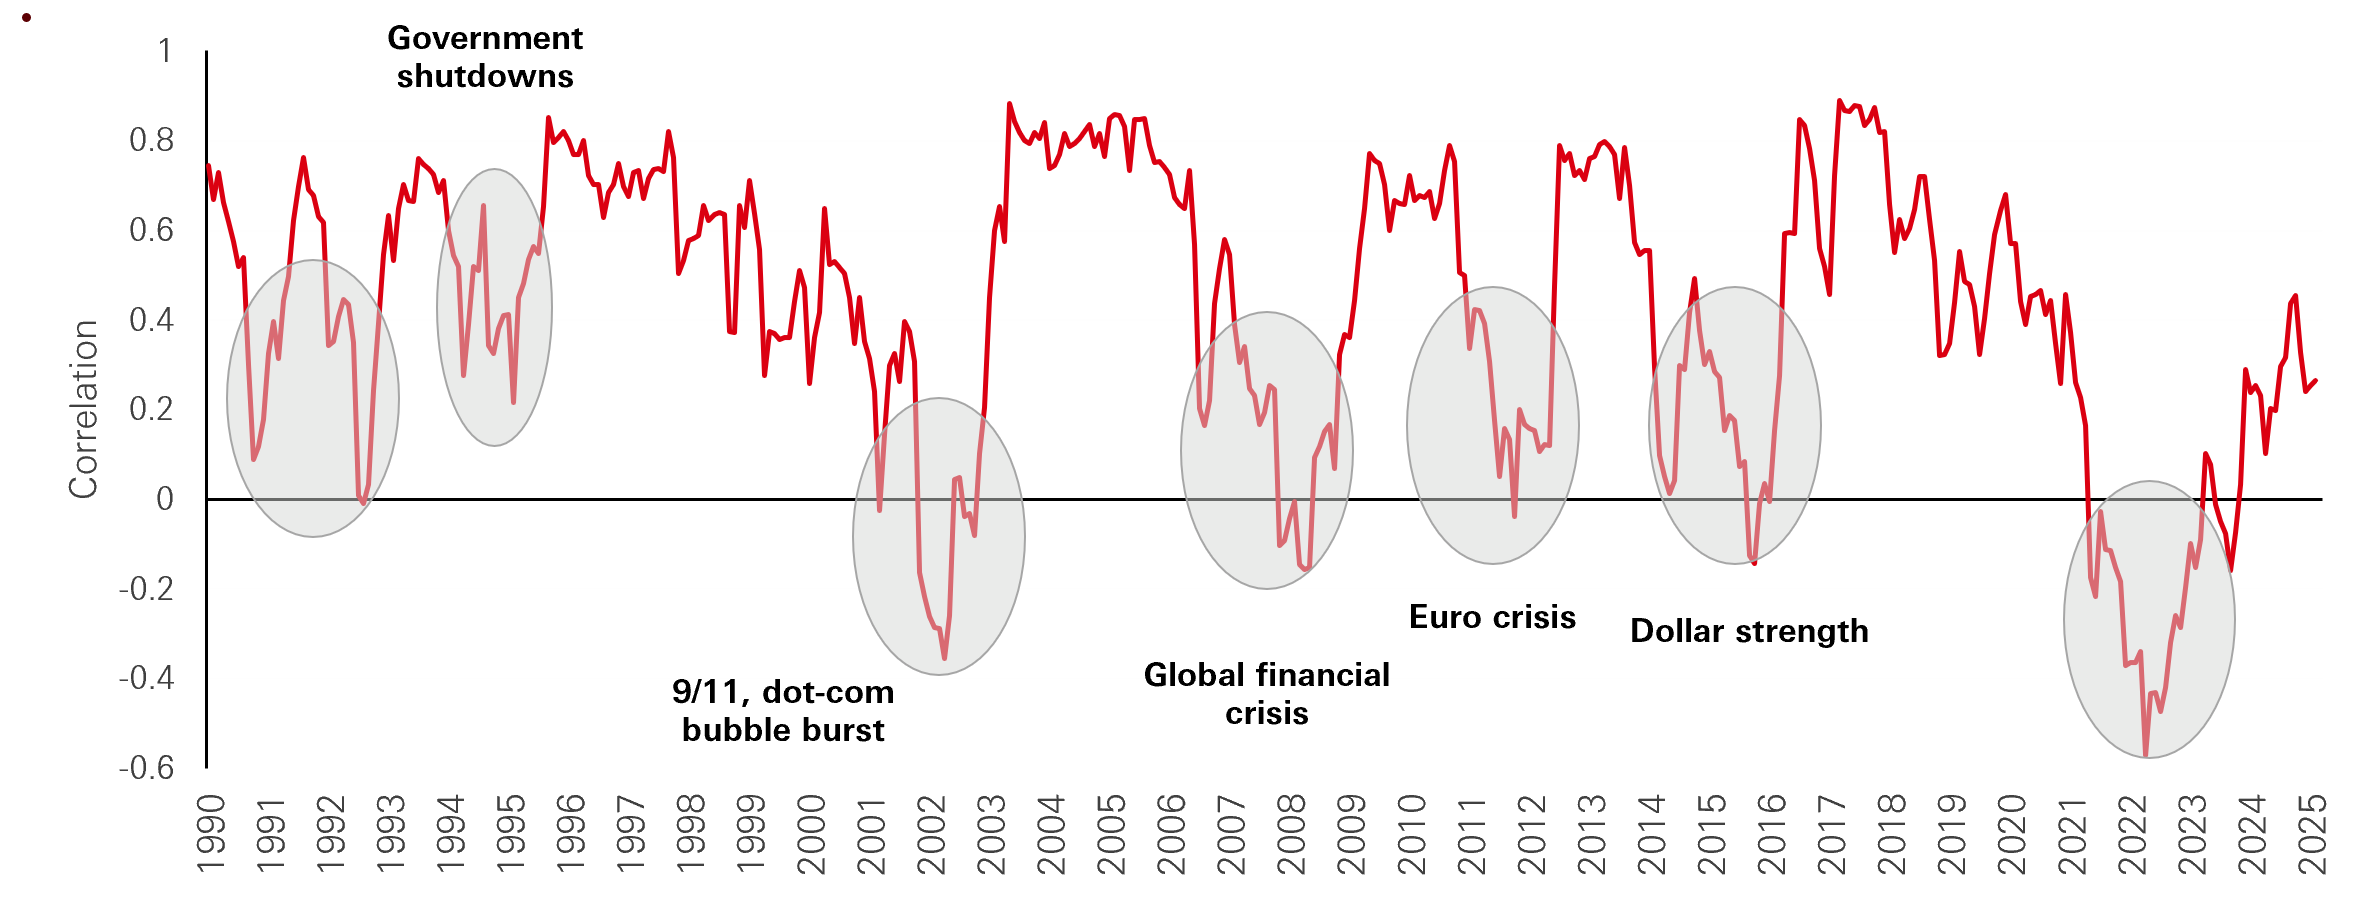
Is there an evergreen hedge against equity tail risk?
Defensive assets are firmly back on investors’ radars in the wake of events in the Middle East, with volatility spiking across asset classes. However, history shows there is no ‘one size fits all’ hedge, and effectiveness depends on the source of volatility and the broader macro regime.
Government bonds have long been the default safe haven, but the sharp, simultaneous losses in both equities and bonds in 2022 have refocused attention on their positive correlation. It is important to note, however, that the stock–bond correlation is dynamic and dependent on the macro regime, which in turn determines how effective bonds are as an equity hedge. Typically, when real rates are rising and inflation risk dominates, stock–bond correlations tend to increase; when growth risks rise and monetary policy turns more accommodative, flight to quality flows typically push correlations lower.
Historically, a positive stock–bond correlation has been the most persistent regime, yet bonds have still provided effective downside protection in many financial crises, dating back to the late eighteenth century. By contrast, bonds have struggled during periods of elevated military spending, where the fiscal burden of extra defence outlay is often placed on bondholders. With today’s mix of elevated fiscal deficits, rearmament and persistent inflation uncertainty, investors cannot assume government bonds will always hedge equity tail risks.
Similarly, cross-country equity correlations have been elevated over the last two years, with most regional pairings clustered around 0.6-0.8. Instead, sector diversification has become a more important diversification lever, with areas such as consumer staples, utilities and telecoms exhibiting relatively low cross sector correlations. These defensive traits have persisted across several crisis episodes, but they are not regime agnostic. Factor tilts such as quality and value have also offered partial, but not unconditional, diversification.
Currencies and commodities are another common destination for safe haven exposure. Historically, the US dollar, Swiss franc and gold have been among the most reliable protectors in equity drawdowns, but even they are regime dependent: the dollar weakened after ‘Liberation Day’ as confidence in US policy direction eroded, while gold underperformed in the aftermath of the Ukraine invasion as real yields spiked.
Finally, options are directly linked to volatility and have provided a reliable negative correlation to equity markets during crises, while generally retaining good liquidity. There are several option-based strategies that can be employed, such as protective puts, collars and covered calls, each with distinct trade offs between costs and protection, but none working across all market environments.
Overall, there is no evergreen hedge for equity tail risk, so in practice defensive positioning tends to rely on a diversified toolkit that is calibrated to the prevailing risk regime rather than on any single asset. The experience of 2025-26 – when bonds failed to cushion shocks consistently – underlines the case for dynamic, scenario-based hedging.
Figure 3: The stock-bond correlation has varied across time and regions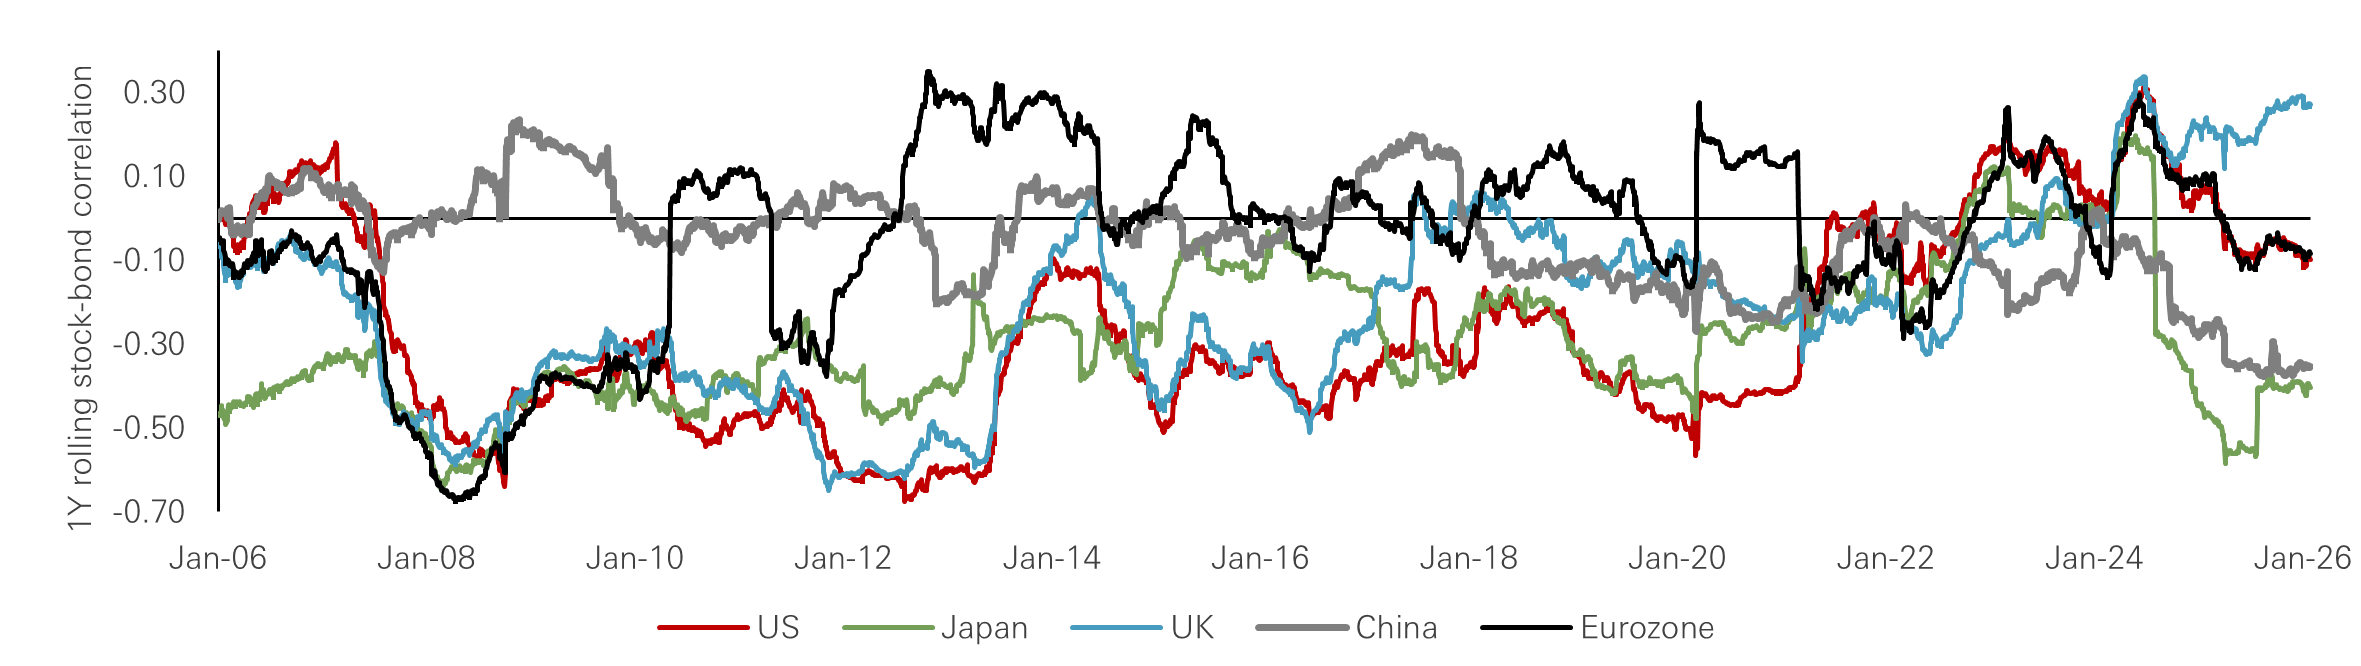
Click the image to enlarge
Source: HSBC AM, Bloomberg. Data as of January 2026.
Why do dividend and income strategies matter even more in equities now?
After a long period in which investors were rewarded primarily for owning growth — and, in practice, a relatively narrow group of US growth stocks — the case for income is becoming more compelling. That is not because growth no longer matters, but because the market backdrop has become broader, more volatile and more sensitive to valuation. In that environment, dividend and income strategies offer a useful way to balance participation in equity markets by relying less exclusively on price appreciation to deliver returns. The underlying reason is that dividends remain a significant driver of long-term equity returns. Over the past two decades, more than half of total global equity returns have come from reinvested dividends.
Figure 4: Price versus net index returns (USD)
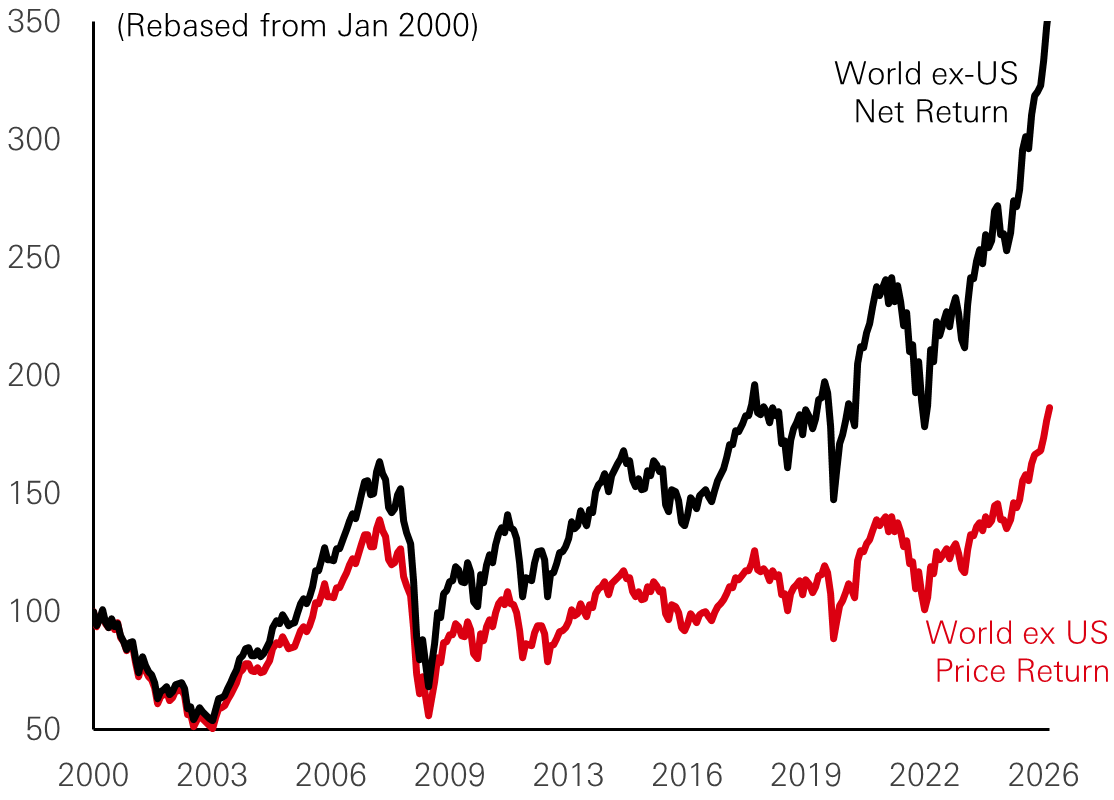
Click the image to enlarge
Past performance does not predict future returns.
Source: MSCI, HSBC AM, Refinitiv, March 2026.
Yet, this contribution is often underappreciated during periods when capital gains dominate market narratives. In fact, the dividend factor has historically been more resilient than many investors assume. Dividend yield has generated positive alpha across a range of macro environments and, unlike many traditional value exposures, has often held up relatively well even when the cycle weakens.
In recoveries, yield can benefit from rerating as depressed prices normalise. In expansions, cash-generative businesses still participate in the upside while offering an income cushion. In slowdowns, investors tend to place greater value on visible cash flows and established payout policies. Even in higher-rate or inflationary environments, markets generally become less willing to pay for distant cash flows and more focused on companies able to return capital in the near term.
At the same time, global dividend payouts have continued to rise, reaching record levels, with growth extending across regions rather than being confined to a narrow group of markets or sectors. That breadth matters because it suggests income opportunities are not scarce; they have simply been overshadowed by the concentration of attention on growth. Regionally, income is often associated with mature developed markets, yet Asia increasingly looks relevant as well, particularly where stronger balance sheets, improving governance and rising payout ratios are creating scope for both dividends and buybacks.
More broadly, income now offers something especially valuable: diversification. Equity income is becoming more relevant not as a retreat from growth, but as a way to build a more resilient equity allocation across market regimes.
Figure 5: Regional dividend yield gap to US
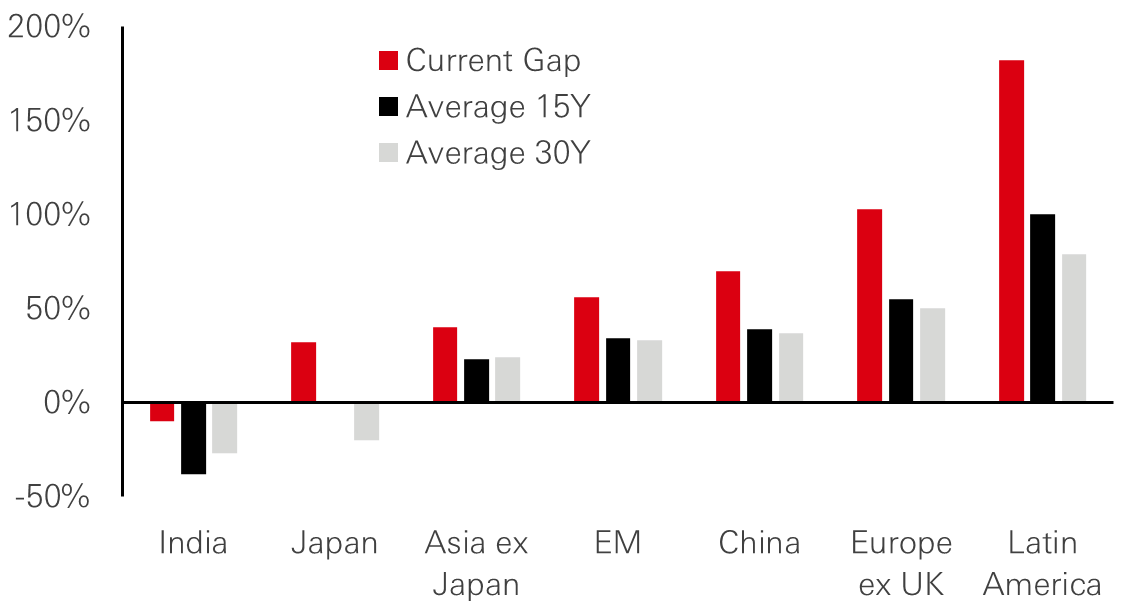
Click the image to enlarge
Past performance does not predict future returns.
Source: MSCI, HSBC AM, Refinitiv, March 2026.
In the current environment, the most useful way to think about equity income is not as a pure yield strategy, but as a balance of three return drivers: yield, growth and valuation support. It can soften factor concentration, reduce reliance on multiple expansion and provide a more durable source of return when markets become less forgiving. Equity income is therefore becoming more relevant not because investors should retreat from growth, but because the market is placing a higher premium on resilience, discipline and valuation support.
How have unloved European banks captured investors’ attention?
European banks have long been shunned by investors who lost confidence in a sector maligned by two major crises and heavy regulatory scrutiny. Profitability plunged following the 2008 global financial crisis and the eurozone sovereign debt crisis in 2012, and remained under pressure through the subsequent era of negative interest rates. More recently, however, the sector has sparked back into life, with share prices outperforming other sectors in Europe over the last 12 months.
Figure 6: European Banks’ valuations
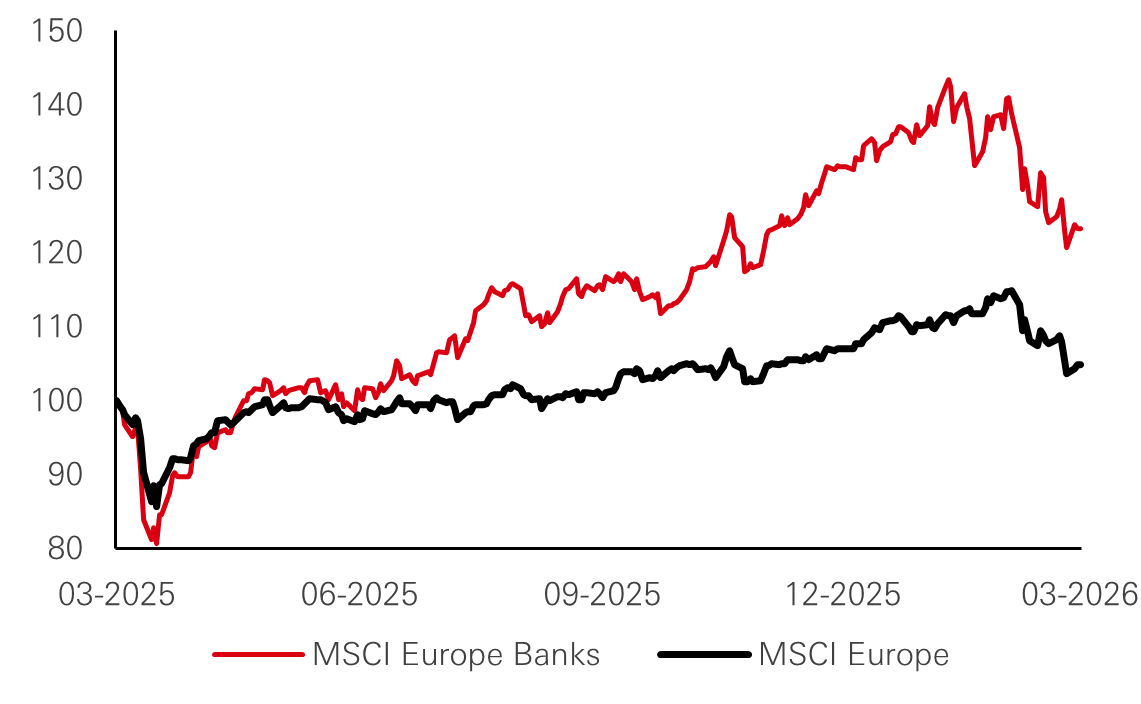
Click the image to enlarge
Source: HSBC AM, Factset, March 2026.
The journey back to prominence has been multi pronged. Banks are now reaping the rewards of the painful work undertaken in the decade after the crises: wide ranging cost cutting programmes, including branch closures, headcount reductions and the sale of non-core operations, have resulted in more simplified business models.
At the same time, steep capital requirements enforced by regulators have made balance sheets more robust and capital positions markedly stronger than in the pre crisis era. This strong capital and cash generation has often been returned to shareholders via cash dividends and buybacks, leading to high and recurring payout ratios. External factors have also been significant. The surge in inflation from 2022 forced the European Central Bank to abandon its negative interest rate policy and raise rates sharply. This steepened yield curves and helped restore banks’ net interest income margins towards pre crisis levels.
The European banking landscape is not homogeneous and can be broadly broken down into three categories. The first group consists of restructuring or self-help stories. These institutions are still simplifying their business models, selling non-core assets, refocusing on profitable segments and driving down costs. For investors, they offer upside potential but also carry higher execution risk.
The second group comprises growth stories with a strong focus on Southern and Eastern Europe. These banks operate in markets where GDP growth is faster, banking penetration is lower and demand for credit and financial services is expanding as middle classes develop. They offer a blend of growth and yield but also come with additional geopolitical and regulatory risks.
The third group consists of high capital return, retail-focused champions. These banks are often dominant in their domestic markets, with strong franchises in retail and small business banking, as well as wealth management activities. They typically command higher valuations, given their track record of solid and predictable dividends.
There are also important regional differences. Most striking is the dramatic turnaround in the fortunes of Southern European banks—particularly in Spain and Italy—as well as those in Greece, which were once at the epicentre of the eurozone crisis. These banks have made significant progress in shoring up their loan books and are flourishing in the new rate environment.
At this stage, risks still remain for the sector, most notably from recent tremors in private debt and the wider shadow banking system. The main systemic risk is less about bank solvency and more about second-round effects from non-bank credit markets. Even so, European banks appear better positioned to weather potential storms.
Despite the improvement in fundamentals and the significant share price appreciation, European banks still trade at a significant discount to the overall market. This leaves room for investors to continue benefiting from the sector’s improved profitability and strengthened capital positions, but the sector’s heterogeneity argues for a selective approach.
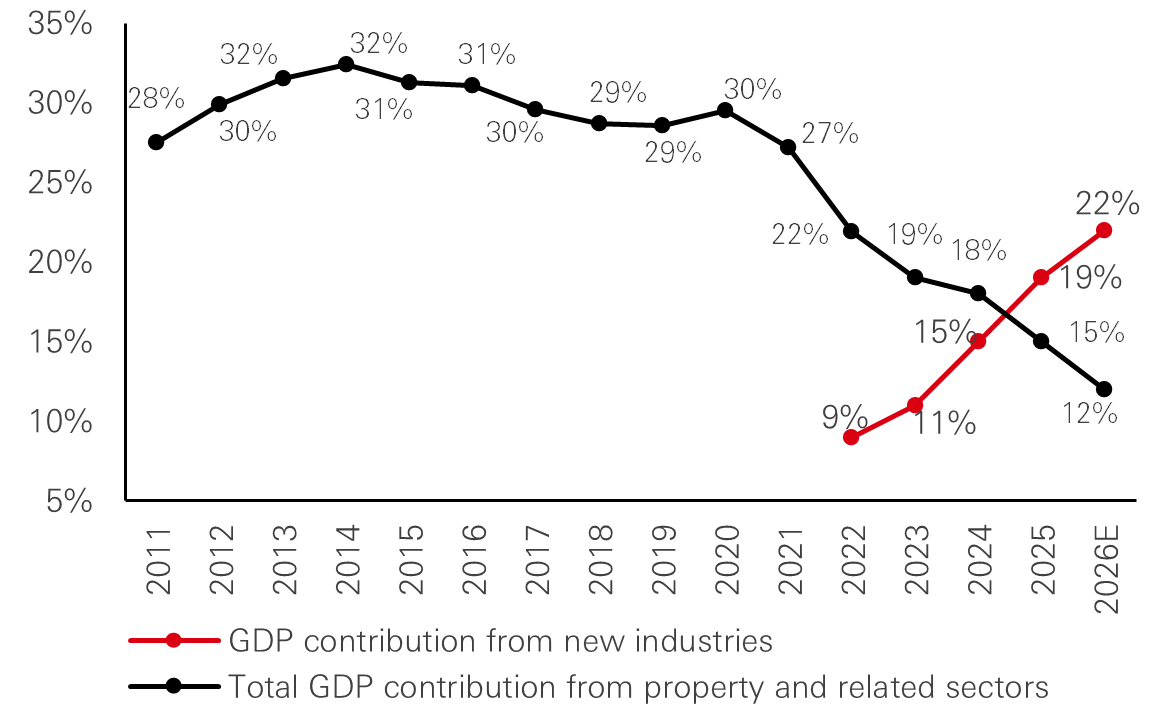
How is China’s economic rebalancing reshaping its investment case?
China’s post-pandemic recovery has been marked by several structural challenges, with deflation emerging as one of the most important. Destructive price competition in oversupplied industries has contributed to lower prices and compressed corporate profitability. Policymakers have responded with an ‘anti involution’ campaign aimed at discouraging race to the bottom pricing. The broader objective is to reorient the economy away from low quality, cost-driven expansion and towards innovation-led growth by redirecting economic incentives to productivity, innovation and higher value creation.
That direction was reinforced in March, at the latest National People’s Congress, where policymakers emphasised that technological capability, industrial upgrading and domestic demand will shape the next phase of growth, marking a shift away from relying on broad stimulus. The same priorities sit at the heart of China’s 15th five-year plan, which focuses on strengthening technological capacity and raising productivity as key pillars of a more self reliant, higher quality growth model.
The country has already made significant strides in this rebalancing. It is a major participant in the development and proliferation of artificial intelligence, with large companies deploying AI applications at scale. Biotechnology is another area of progress, with Chinese companies developing early stage molecules and licensing them to multinational pharmaceutical companies, signalling a gradual shift toward intellectual property innovation.
Meanwhile, in advanced manufacturing, China has established itself as a leader in robotics, where integrated domestic supply chains give its companies a price advantage versus international competitors.
Figure 7: Household income and consumption as per cent of GDP
Click the image to enlarge
Source: MSCI, Bloomberg, RIMES, Factset, Morgan Stanley Research, December 2025.
For investors, this long term structural transformation is significant. Against this backdrop, China’s equity market is gradually moving from valuation led stabilisation towards an earnings led recovery. This recovery is aided by policy measures aimed at stabilising demand, improving pricing discipline and supporting mild reflation in the economy.
Notably, equity market expansion is likely to have a different composition compared to past cycles. New industries such as electric vehicles, advanced manufacturing and biotechnology are replacing the troubled real estate sector as the primary engine of earnings growth.
Domestic factors are creating an additional tailwind for China’s capital markets. Chinese households have accumulated large piles of cash savings in recent years, with bank deposits now exceeding national GDP. As deposit rates fall, part of this liquidity is likely to migrate into higher yielding financial assets, with early evidence already pointing to rising allocations to domestic equities and investment funds.
China’s fixed income market is also becoming more relevant in a global context. Now the second largest bond market in the world, it offers both scale and diversification. A key feature of Chinese government bonds is their relative independence from the global rate cycle. This has been evident in the current environment, where the deflationary pressures faced by China contrast with the inflationary pressures and tighter monetary policy seen in many other major economies. Since Chinese bond yields respond predominantly to domestic drivers, they have historically moved with relatively low correlation to other major bond markets, positioning renminbi fixed income as a strategic source of diversification within global portfolios.
How compelling is the case for Indian assets after the US trade deal?
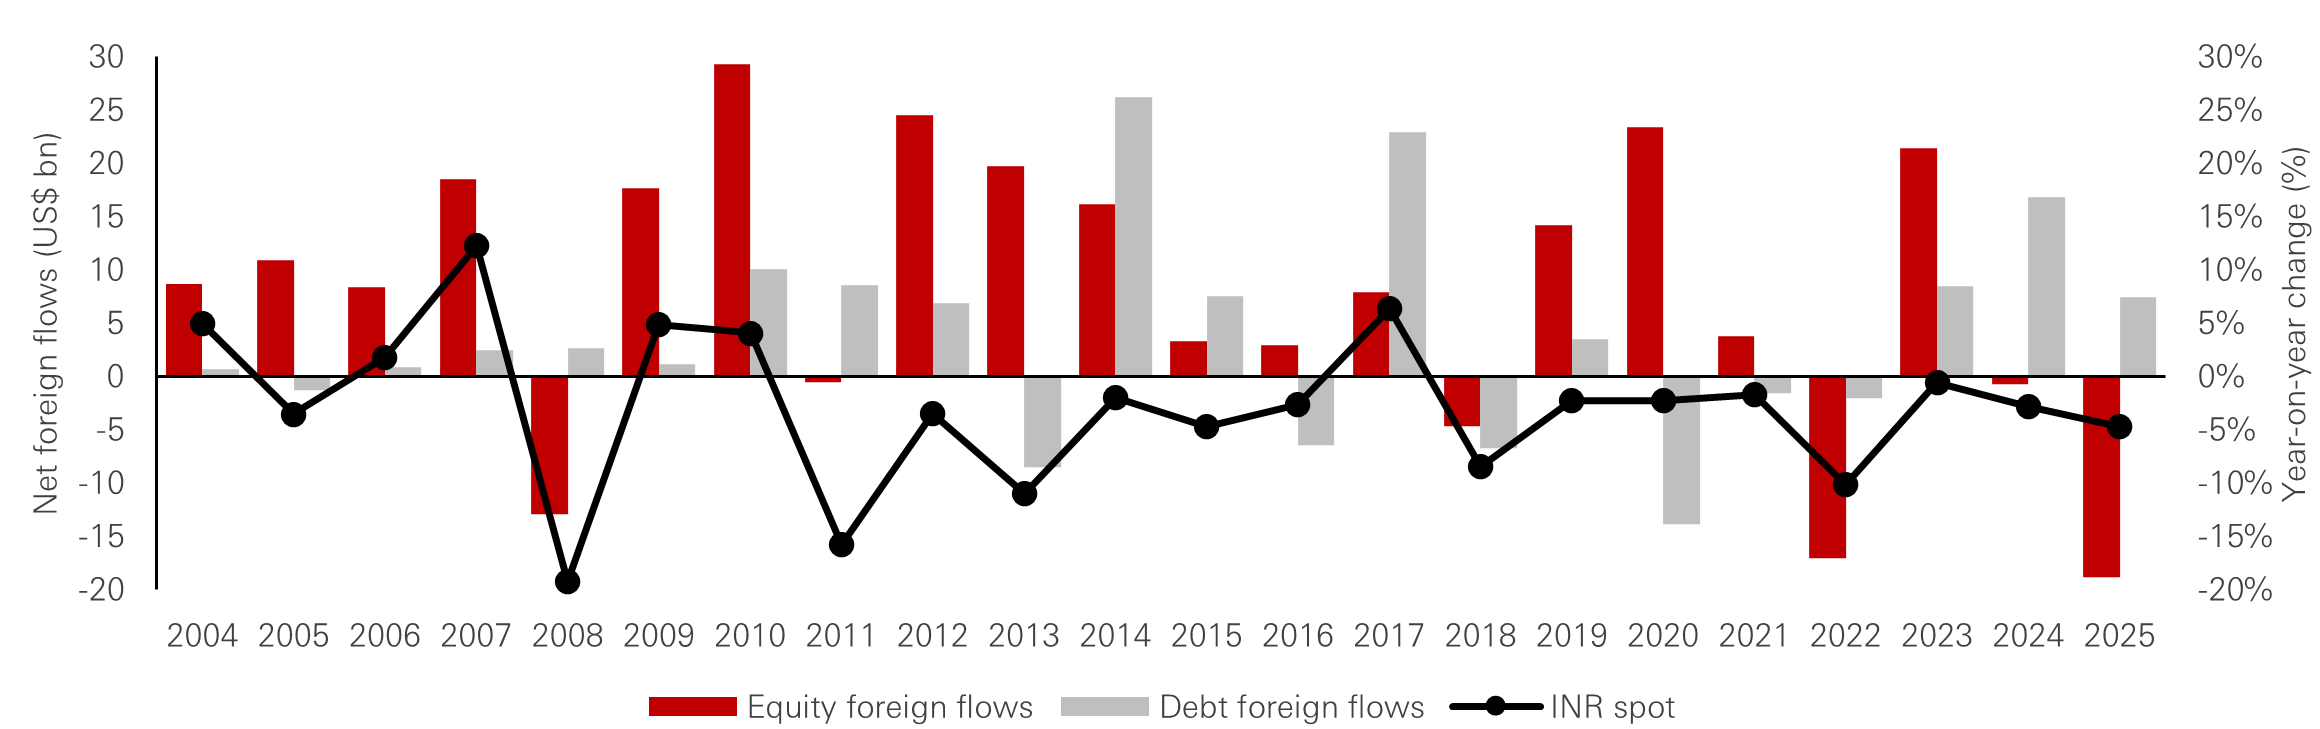
Despite recent outflows, stretched valuations and geopolitical noise, the underlying picture for Indian assets remains more resilient than headline market moves imply. For equities, strong domestic liquidity continues to provide an important anchor, while in fixed income, disciplined fiscal management alongside heavy issuance is shaping a more nuanced return profile.
Before February’s landmark US trade deal – which reduced the effective US tariff rate on Indian goods to 18 per cent from around 50 per cent – Indian equities had experienced their largest annual net foreign outflow on record, at US$18 billion in 2025. The announcement triggered a relief rally in both the Nifty 50 and the Indian rupee, allowing investors to refocus on fundamentals rather than trade related macro noise.
Beneath the volatility, the underlying backdrop is more constructive. Absent a prolonged and materially disruptive conflict in the Middle East, the combination of robust domestic liquidity and stabilising earnings underpins the case for Indian equities.
A deeper local investor base has become a crucial shock absorber. Domestic institutions and a steadily growing retail participation have together channelled around US$86 billion into the market, offsetting foreign selling, limiting drawdowns and smoothing volatility. This increasing reliance on domestic capital means Indian equities are now less exposed to swings in global risk appetite than in previous cycles. The earnings picture has also become more balanced. Earlier forecast downgrades have mostly abated as financing costs ease and operating leverage improves in rate sensitive sectors such as financials, real estate and consumer discretionary.
Figure 8: Net foreign flows in India market capital versus INR/USD spot change year-on-year
Click the image to enlarge
Source: HSBC AM, Bloomberg, March 2026.
The US-India trade deal should provide an additional earnings tailwind over time by gradually supporting export volumes and margins in textiles, gems and jewellery, marine products and other tariff sensitive categories.
The trade deal also has implications for India’s fixed income market. Government bond supply remains significant, with the latest Union Budget signalling total spending growth of 7.7 per cent year on year, while keeping the fiscal deficit on a gradual consolidation path. In this context, the US trade agreement removes a key external constraint by improving balance of payments expectations and reducing currency risk premia, potentially drawing more foreign interest to help absorb supply. On the credit side, the combination of resilient domestic demand and export tailwinds supports corporate fundamentals, an important backdrop for local credit spreads.
Overall, the case for Indian assets has become less about relief from a single policy event and more about the interaction between domestic buffers and an improving external backdrop.
Source: HSBC AM, March 2026. Past performance does not predict future returns. Diversification does not ensure a profit or protect against loss. Any views expressed were held at the time of preparation and are subject to change without notice. While any forecast, projection or target where provided is indicative only and not guaranteed in any way. HSBC Global Asset Management accepts no liability for any failure to meet such forecast, projection or target. For informational purposes only and should not be construed as a recommendation to invest in the specific country, product, strategy, sector, or security.